Map Detective – Burgess Park, South London was the final project for the online course I took, Maps and the Geospatial Revolution. The course was primarily about working with data and maps, but the final assignment could be about anything. I chose to create a personal “Story Map” about Burgess Park, a park that I lived near in London last fall. As I was researching the area of London that I lived in, I was noticing Burgess Park was not on any of the 18th or 19th century maps, nor was it on early twentieth century maps. I thought this was unusual because most large green spaces in cities were originally the grounds of a large estate or some other open area. The area that it now occupies was the typical dense nineteenth century London neighborhood, near a canal. I wasn’t looking at “modern” maps as part of my neighborhood research so I had to enlist the librarian’s help in locating Ordnance Survey maps from the 1940s-1990s to learn more.

The truth is, I could have read about the history of the park on Wikipedia, Bridge to Nowhere, or find so Tim Charlesworth’s book, The Story of Brugess Park, but it was more fun to sit in the world famous British Library and pull map after map and pour over it with a magnifying glass, discovering streets that did and did not exist over time, and see how the Surrey Canal was linked to the larger canals in Bermondsey.

But how do I take all of this information and distill it down to one story? I had to make some decisions. First – since the class introduced ArcGIS, I was interested in working with ESRI ArcGIS and ESRI Story Maps. ArcGIS allows you to make maps and Story Maps is a platform with which you can compose your elements: maps, photos and text. They have created a series of templates for various kinds of presentations.

Working with a software template has always been a challenge for me. As a graphic designer, I’m used to making things the way I want them to be, not how someone else has speculated what they think people want. (Much like the blog software you are reading this on. There’s only so much I can do with it.) But templates make it easy to get something up quick and if you do a couple of work arounds, you can get a decent product.
Process
 First I had to review the assets I had to work with. I had several photos of old maps, taken at the British Library, photos of the current park that I took and a good story. I made a list of all of this and included notes of what I want to present. Making tiny sketches on paper, I began to refine what I wanted to show and create six categories: Opener, Burgess Park History, Remnants of the Past, Burgess Park Today, My Personal Data and a Credits screen. This gave me a good blueprint to work with.
 Next – what can the software do for me? There is a wealth of free data that you can use in ArcGIS, but I wanted to use a lot of photos. I had to do some testing to figure out how I could best use my photos, where to put text and how to create links. I also had to fulfill the parameters of the assignment. The assignment could be about anything, but why take a course about geospatial data and not include some actual spreadsheet-like data in it? I have been collecting some personal location data on my phone for a while now so I decided to use that. Now I just had to fiddle around with the software to see what I could get it to do within a few days. (It’s always great to have a deadline!). I watched a couple of videos to get started. I learned that you could embed a Story Map in a Story Map. That sounded good. I poked around in ArcGIS and found a couple of layers that other people made that I thought I could use.

I made a couple of test maps to try out the tools: http://arcg.is/2jzEHYO and http://arcg.is/2jneWL0
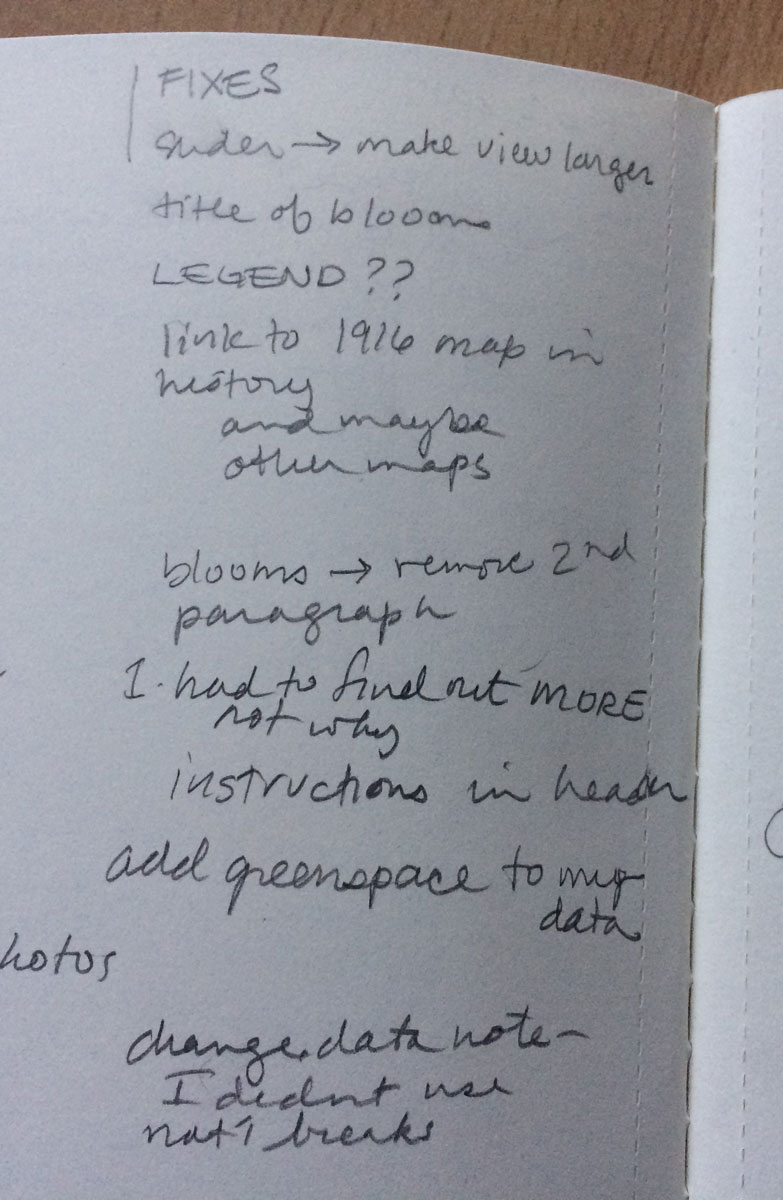
As I put the project together, I was still learning how to manipulate the software. I referred to my sketches to stay on track. As usual, my information was all over the place, but as I populated the project on line, eventually, I collapsed two of the sections into one. I also decided how and where to put images. I wanted make sure I was making a story that flowed. As I worked, I kept a list of things I needed to fix before publishing the site.

I used three different templates in my Story Map. One housed the whole project and two were embedded into that main template. It’s a challenge for me to use tools as they are packaged and I tell my students “don’t use the default settings in your software”.
I’m happy with the final result and I think I pushed the capabilities of the software a bit.
See the project here: Map Detective – Burgess Park, South London
Here is a breakdown of the project sections:
 1 A park emerges – Map Series, Slide Accordion template. The opener locates the park in London and gives a little bit of the background of the project. I could have started out with a map, but decided to feature large maps in other sections for variety of scale. What I’m not happy with here is that you must scroll to see the rest of the text, and small map, in the left panel.
 2 Remnants of the past – Swipe template. This section takes you right into discovery mode thanks to the Swipe template. The black and white map on the left is a digital version of an 1895 Ordnance Survey London map that I found on ArcGIS. You can see how it has been digitized in sections. (Enlarge the map for the most detailed street view.) These maps were made by the Ordnance Survey, a mapping company that is still in existence today. The OS map has been rectified to the current open street map. By moving the slider, panning and enlarging the image, you can compare the old and the new. You can click on markers to see photos of what is in the park now. Pink indicates surviving structures and blue indicates new things. Unfortunately, in this mode, the ArcGIS legend does not seem to be viewable.
The Swipe template is embedded in the Slide Accordion template. Both have a large black title bars across the top. I chose to put the directions for using the Swipe template in the Swipe title bar, so I didn’t end up with two titles.
 3 What blooms in Burgess now – Map Series, Bulleted, template inside the main Map Series template. These show the two options in Map Series. Clicking the circles advances to the next picture. Here, the black bar is used as a subtitle. The page is getting crowded with the introduction of the second vertical panel that houses the images. I chose to make the maps small to highlight the photos. Clicking the images shows a larger view. Clicking the map takes you to ArcGIS to see the entire map. I need to figure out how to change the legend on this map – it is not helpful as it is. Also I’ve noticed that when you click to enlarge the photos, the captions don’t always match what is with the small image.
 4 Burgess Park and me – This is where I’ve imported my own data from my iPhone, using FrickBits. The data comes in as latitude, longitude and “UTC”. My husband / programming guru helped me change the UTC code into dates and times. We took it one step further and separated the time into “morning”, “afternoon” and “evening”. In doing so, the time of day is easy to visualize. When I left the time and day as one continuous set, I could only separate the times by using a gradated color or changing the size of the dot. Both of these options were not helpful, as they were a bit meaningless. I thought this solution was simple, but works well. You can click on each dot and get a date – if you want to. I do need to get rid of “attribute 2” and I could probably add the time of day back in. If you click through to ArcGIS (link is at the bottom #4), you’ll see my data is mapped onto “London_Open_Space”, which was shows parks and is created by another party. While in ArcGIS, click the information icon to find out more. You can turn layers on and off in Content and use Bookmarks to see other London parks I visited.
5 Credits and more information – This is a big story to tell, and I put as much into the templates as I could – hopefully without boring the viewer! Scroll this section if you want to dig further, and see a few older maps and an website called Bomsight.com. And of course, I’ve included the url to this blog!
A couple of other issues – I’m still working on how to configure Legends. On some of my maps, you can’t see the legend and/or there is too much information – for instance, when you put a symbol on a map in ArcGIS, the legend shows every possible symbol. Not sure what that is about.
Within Story Maps, I would like to go full screen with ArcGIS maps, instead of having you click through to ArcGIS in a separate window – because you are leaving my site.
Photos – on ArcGIS maps, I used flickr to house my photos, with a workaround to get the images into the pop up boxes. Next time, I’d do this another way, because when you click to enlarge the image, it is presented inside the flickr interface. And you are leaving my site.

My geolocations – the locations do not always seem to be precise. Contrary to what the data shows, I really didn’t spend much time in the Thames river, except on Nov 5, when we went mudlarking in the afternoon. You can also see that the points that were recorded are clustered. For instance, if you use the bookmark to go to Myatt’s Fields, all the points on on the west side of the park. I was in all corners of that park. Also, there may be no point recorded for other places I have been.
I hope you are not viewing the site on your phone, it doesn’t look very good on an iPhone or an Android.
If you want to give Story Maps a try, you can get a free account. There is a lot of information to help you get started.
Learning this software and taking the online course was a major part of my sabbatical. Please don’t hesitate to contact me or leave a comment if you have questions!
You must be logged in to post a comment.